TfN has launched a new visualiser tool and report revealing where community severance is most likely to be experienced when accessing key, basic services. We caught up with our social researcher, Tom Mace, who worked on the tool development and gave us an overview of the project.
The likelihood is, we’ve all faced a barrier when travelling at least once. The barrier might have been time-related, such as extreme and severe weather like flooding, wind, or wintery conditions. It might have been information-related, the not so real time information provided by a public transport operator wasn’t accurate, so you faced delays. Or it might be that we were in area that you felt wasn’t navigable due to public realm design. Regardless of the barrier and its endurance, these are examples of community severance.
When you begin researching community severance, you quickly realise that there isn’t one singular definition. It doesn’t even always have the same name – ‘the barrier effect’, ‘transport-related infrastructure severance’, even just ‘severance’ are some of the names given to the area of study. Despite the multiple definitions and names, they all generally attempt to meet the same aim which is to explain how infrastructure can act as a barrier to movement, impacting people, behaviours and perceptions, and the environment.
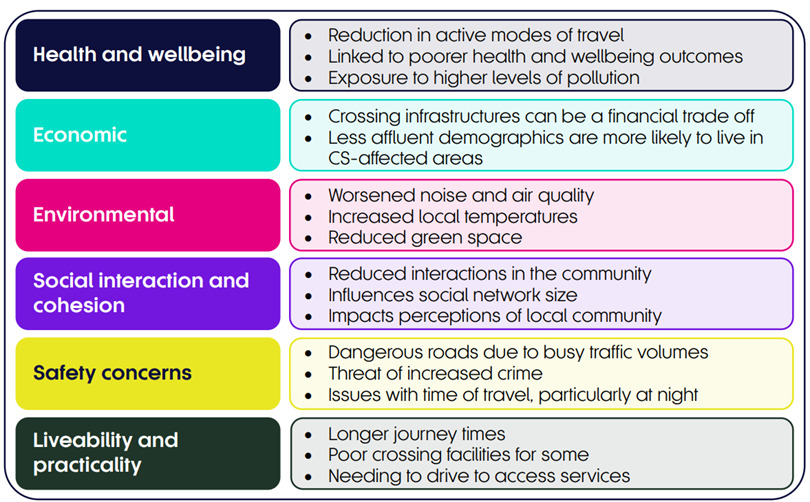
Generally, much of what is known about community severance comes from fieldwork methods such as surveys, interviews, and focus groups. As such, the impacts associated with community severance are hard to quantifiably establish. Nevertheless, poorer health and wellbeing outcomes have been associated with community severance as have social network size, economic trade-offs, community interactions, personal safety, environmental concerns, social isolation and exclusion, and questions over the liveability of an area.
When undertaking a literature review on the topic, it was clear that six broad categories of impacts were present.
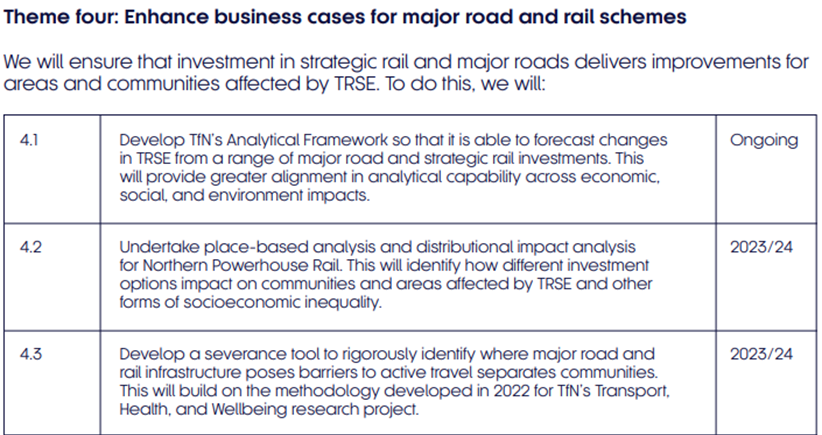
Back in 2022, TfN published Transport, health and wellbeing in the North of England which aimed to understand the effects of transport on the health and wellbeing of people. This piece of work aimed to better equip TfN with knowledge when devising strategies and its statutory advice. One of the effects of transport on health and wellbeing was community severance. Later in Connecting Communities, under the theme of enhancing business cases for major road and rail schemes, we committed to developing a tool which would identify where infrastructure like major roads and railways were posing as active travel barriers.
This led us to scoping out a tool that would reveal where community severance is likely to be experienced as a result of the strategic road network (SRN), major road network (MRN), and rail network when accessing key services. By creating this tool, we felt this would be an effective way to support our local partners, through the TfN Offer to better understand community severance on a national, region, local, and even hyper-local level. The addition of this tool makes our current suite of tools such as the transport-related social exclusion tool and the clean mobility visions tool stronger and allows us to better understand our region.
Due to data availability, we decided to focus on a select key services for this first version of the tool. We gathered data that would show us accessibility to primary schools, secondary schools, further education, GPs, and hospitals in light of SRN, MRN, and rail network presence. We then combined relevant datasets together to create healthcare and educational domain-type datasets. This allows us to look at the general accessibility of destinations independently as well as when grouped together.
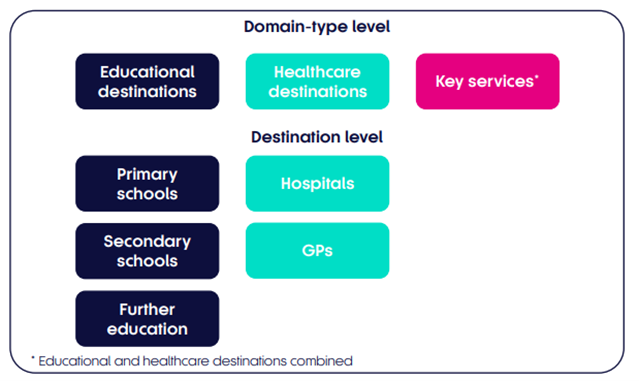
As well as grouping destinations into relevant domain-type level datasets, we then grouped the educational and healthcare domains into one and named this ‘key services’. It’s important to note that a handful of educational and healthcare destinations do not constituent all key services needed for a happy, healthy, fulfilling life. However, due to the data availability issue and other resourcing constraints, these were the destinations we were able to focus on. We do hope that in the future, this tool can be further developed. It would be great to see additional destinations incorporated in the tool along with different barrier types.
Visualising community severance
The tool we developed is hosted on ArcGIS Online which is an interactive web-based mapping software. This essentially allowed us to create a webpage that is home to the below interactive map visualising where community severance is likely to be experienced.
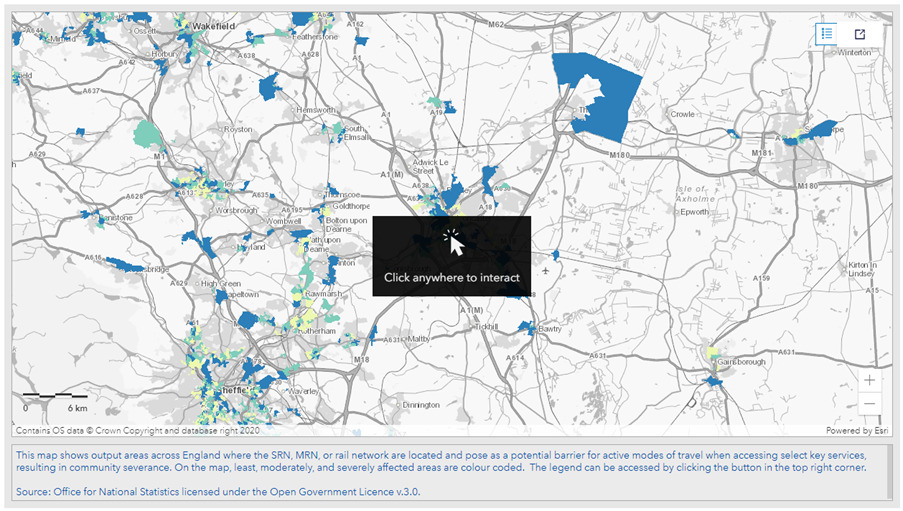
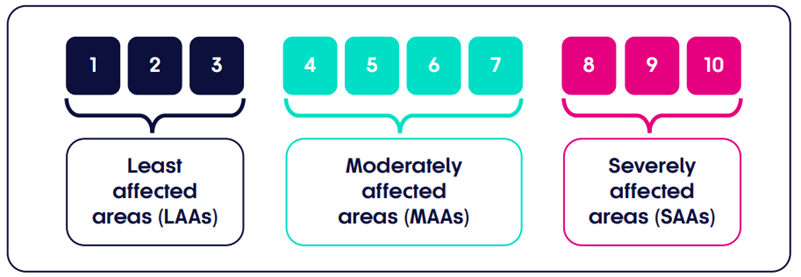
Our report explores how we devised the visualisations in greater detail, but we categorise the areas that are highlighted on the map into three different classes of affected area types based on a severance index scoring system. Areas that score one are affected by community severance, but to a lesser extent, and areas scoring ten are the most affected.
This scoring system provides useful context that can be used at a strategic level. It shows that some areas are more affected than others and this is useful when wanting to reduce rates of transport-related social exclusion – an associated impact of community severance and a key priority in TfN’s Strategic Transport Plan.
Revealing the rates of community severance across England
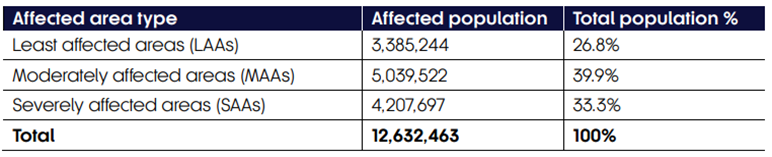
Thanks to the scoring system and the underlying data from the tool, we were able to analyse community severance rates across England. By doing this we found how many people were at risk of experiencing community severance as well as the regions with the highest proportion of people at risk.
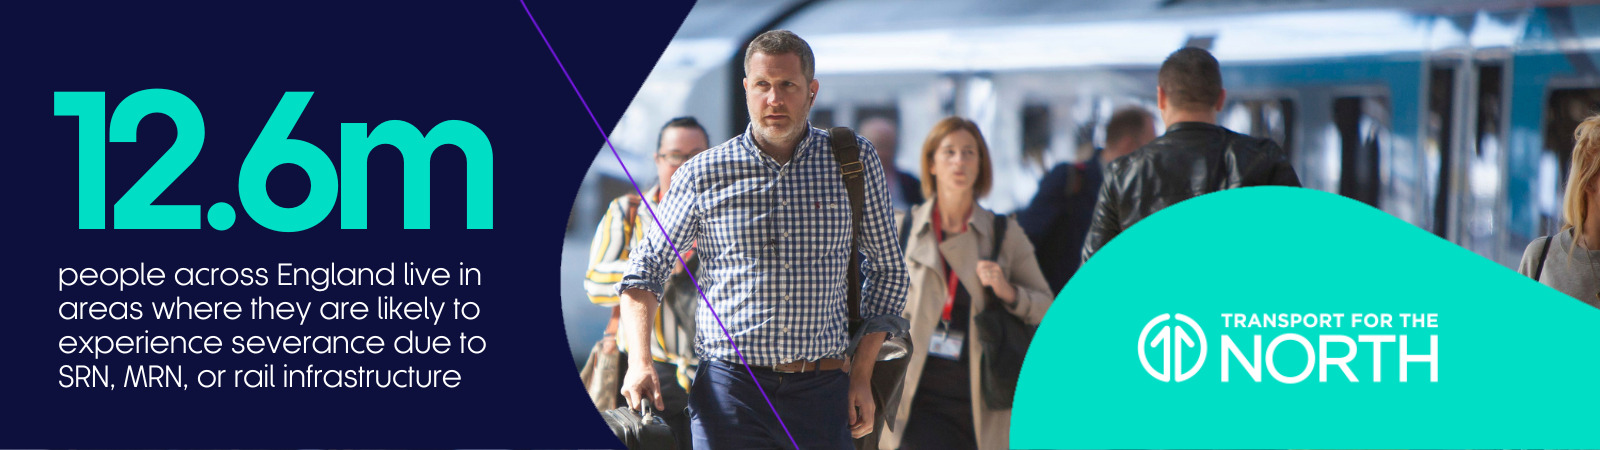
We found that 12.6 million people in England live in areas which give them an increased risk of experiencing community severance when accessing key services due to the SRN, MRN, and rail network. This equates to around 22.3% of the English population.
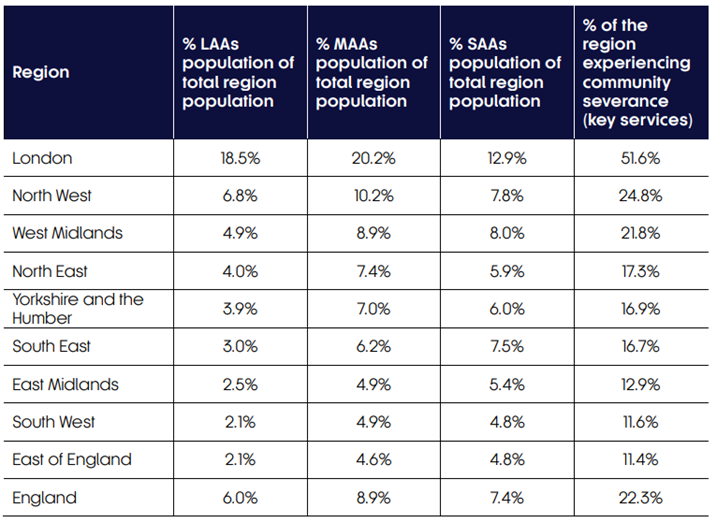
Outside of London, the North West was the second most impacted region. 24.8% of the region’s population live in affected areas. Elsewhere in our region, the North East is the fourth most affected with 17.3% and Yorkshire and the Humber are the fifth most affected with 16.9%.
The future of community severance at TfN
Now the tool and report are live, we are keen to hear our partners’ and stakeholders’ thoughts on what we have developed and created. Ultimately, this has been created to assist them in better understanding their area and any challenges local people are facing.
The tool has clear strategic value, but more can be done. The tool could be enhanced with more destination data, and more consideration for other barrier types to give a fuller, more complete understanding of community severance in England.
So please do provide feedback on the tool and what more would be useful to help inform us about community severance as well as support future research.
For further information on the tool and report, please email research@transportforthenorth.com