As analysts in our Transport, Analysis, Modelling and Economics (TAME) team, we are driven by a curiosity to uncover insights and gain deeper understanding of and solve complex problems, innovating through addition of new data and trying new ways to evidence how we can improve the way we invest in transport in the North.
Yes, the work is very technical, but our aims are very simple. We want to make sure the North is getting the best chance of securing the investment it needs to transform people’s lives and provide a world-class transport system which can help grow the economy.
We are pioneering the next frontier of transport modelling with its ambitious mission to better represent the Northern communities within the transport models, and for those models to inform and support Northern business cases and policies. We’ll take a closer look at our progress and recent developments in their quest to simply make the Analytical Framework more Northern…
Analytical Framework Background
Back in 2018, we have identified two types of modelling and appraisal challenges:
Our TAME team was founded with the goal of taking on the grand challenge of improving the representation of Northern communities and their travel behaviour within transport models. Since then, we’ve embarked on a journey of innovation and discovery, attracting the talent from diverse disciplines coming together to shape our Analytical Framework to make it suitable to support transport business cases in the North.
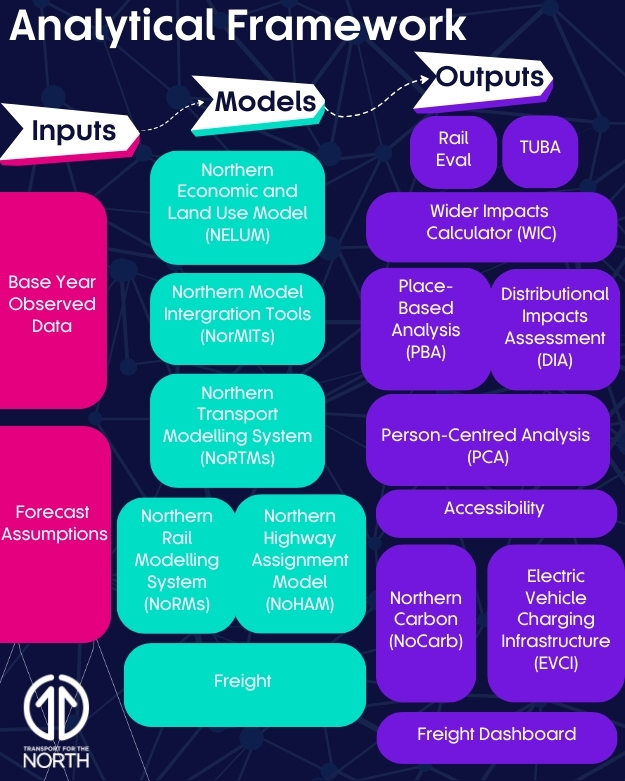
Figure (above): Our Analytical Framework journey so far…
Research
One of our first steps for this was to collaborate with partners to gather our common pain points across the modelling and appraisal practices. We then set out to replicate some of the national models to be able to understand them better and assess the regional limitations of those. On the back of this, our Analytical Framework emerged.
Our Analytical Framework is a collection of data, transport models and tools which form a comprehensive framework for understanding and predicting economic, social and environmental impacts of a transport scheme in the North of England. This is our attempt to overcome the challenges that national averages mask by introducing the local insight to provide more geographical context to the promoters.
Making it fit for the North
Our first step on this journey was to produce a replicant of National Trip End Model (NTEM). This model forecasts the growth in trip origin-destinations (or productions-attractions) up to 2051 for use in transport modelling across England. NTEM area type classification serves the whole of England and does not necessarily represent detailed regional differences.
The first four area type categories are London-based, and all of England’s rural areas are classed into one category despite the big differences between the travel patterns of the population in the rural areas in the North versus the South or London. We have re-classified those in 2019 to improve Northern urban representation of the North, and again recently to further improve the rural representation in the North.
The three categories for age within our NTEM replicant did not represent in detail the population of the North and their travel patterns especially in rural areas. We are currently working to enhance our models and break down those age categories further, starting with our NorMITs Land Use rebase which feeds into all our other models.
Technology
Shift in technology had a great part to play in our goal to be able to build sustainable tools that could be shared with our partners. Being a strategic body, our remit is quite large, however by considering our partners’ main pain points around inconsistent zoning systems and poor local representation we set on modular reusable design wherever possible.
Limited traveller segmentation within transport models had also limited our understanding of the user experience and prohibited us from building an economic narrative. This has perhaps been halted to date by the concerns over long model run times. By moving all our models, data and tools to cloud-based virtual machines and file storage we have enabled a more cost-effective scalable modelling platform with scope for introducing further memory enhancements for machine learning models.
The backbone to our Analytical Framework, NorMITs Land Use, is a good example of this, based on Census data it builds from bottom-up starting with the individual units (properties) and has the ability to segment the population within each Middle- Super Output Areas (MSOAs). These are zones with a typical population of between 5,000 and 15,000 people. These account for occupation, car ownership, gender, type of employment, household size, property type. We have also done this at even more granular level this year, at LSOA but with not as detailed segmentation due to small numbers. This is to provide insight into specific areas and to make it easier to aggregate up and down into any modelling zones and ensure its future use for the partners.
Enhancing our data sources
Limited data sharing was another pain point identified by our partners right at the start. We have tested this assumption and partners’ appetite for sharing by creating a D-Log database – a digital collection of Local Plans from across the North all in one place. In the first year we have managed to collect 72 out of 76 local partners’ data and we are currently rolling out our online D-Log platform system to other STBs.
We try to use innovative data sources like crowdsourced data, mobile phone data, remote sensing technologies to supplement traditional data sources and provide a more comprehensive understanding of transport dynamics and trends.
We have been investing a lot of time to understand the advantages and limitations of mobile phone data to be able to advice our partners and to introduce this additional dataset to enhance our modelling capabilities within our highways modelling NoHAM.
Similarly, we have recently been exploring remote sensing capabilities with the help of Ordnance Survey to develop and train a model to identify driveways; to help our local partners provide evidence to quantify the areas which have less driveways to combat the North South divide in accessing funding for public EV chargers.
Focus on strategic objectives: equity, inclusion and sustainability
Generally speaking, transport investments in areas of higher productivity are more likely to yield higher benefit-cost ratios (BCRs) due to the higher economic activity, larger pool of users and since higher demand for transport and thus potentially greater benefits from improved transport infrastructure.
It is obviously essential to present a business case which has a good value for money, however it is vital to adopt a balanced approach that takes into account metrics that align to a broader variety of Government objectives, such as equity, sustainability and prosperity to ensure transport benefits all communities regardless of their level of productivity. There are simply different challenges and opportunities presented within each region.
Those metrics also help build a narrative for transport business cases in the North and consider the context of specific places and people who would benefit from the enhanced connectivity opportunities presented by a new transport scheme.
Distributional Impact Appraisal (DIA) – a set of tools to assess the distribution of wider, economic and environmental impacts of a new transport scheme across social groups within the scheme’s proximity. Within Transport for the North we have developed and tested our methodology on the Northern Powerhouse Rail scheme to consider the impact the network might have air quality, severance, security, accessibility, accidents, user benefits, noise.
Place Based Analysis (PBA) aims to demonstrate how a scheme affects the geographical areas affected by a new transport intervention. PBA is a process of spatially disaggregating a scheme’s likely outcomes in terms of social welfare impacts and distributional impacts. This includes considerations of Wider Impacts on places, e.g. GVA, agglomeration effects, and it is calculating what impact would the new intervention have on the TRSE index with the improved accessibility in the area calculated as a result of a new scheme.
Person Centred Analysis (PCA) – explains the scheme’s impacts by contextualising what the modelling outputs signify for the residents and communities near the scheme and helps provide the narrative for the business case.
Our Northern Carbon (NoCarb) tool calculates the carbon impact of the new scheme and provides us with an ability to measure a scheme’s impact in respect to Net Zero.
Wider economic impacts – inclusive transport infrastructure has the capacity to connect underserved areas to economic opportunities, potentially fostering local development and entrepreneurship. Models such as NELUM (Northern Economy and Land Use Model) and its future successor can simulate the economic ripple effects of transport investments, illustrating their potential role in economic growth and job creation and the wider benefits, for example agglomeration benefits and Land Value Uplift. Using integrated transport models can capture the multidimensional impacts of interventions on equity, productivity, sustainability and provide decision makers with a more comprehensive insight on the trade-offs of the scheme.
Uncertainty and the future
BCRs are commonly used in transport investment appraisal to assess the economic viability of projects. Cost benefit analysis involves making the best use of fixed resources at a fixed point in time calculated by using existing market prices. Uncertainty, changing policy environment and feedback loops are hard to capture with static metrics such as cost benefit analysis and are not necessarily accounted for as we take the fixed values at fixed point. Scenario analysis can help improve the robustness of the transport schemes and policies.
We have built capabilities to test different economic forecasts into the Analytical Framework such as Common Analytical Scenarios or Future Travel Scenarios which help us make the case for using a more varied approach to treating uncertainty. By exploring different scenarios, and uncertainties, sensitivity analysis can provide us with insights into reliability and credibility of the estimated BCRs considering the long-term implications for communities affected.
Quality and Assurance
While it may be quick to try out a new idea or innovation, the real investment comes in the time it takes to make it robust and trustworthy through thorough testing and refinement. We have conducted rigorous checks every time we add in a new capability to our models and tools. We also seek assurance from Expert Panel members, and we got to work with some big names in the industry, who provide us with valuable critique of the methods, validation techniques and results. Through those rigorous checks and quality assurance by our expert panel, we were proud to see our NoRMs model being listed now on the DfT’s Business Critical models.
One of the other key issues of developing a business case is time it takes to develop one. This is being addressed by our work on Transport Intervention Needs Assessment (TINA). Work on business cases (as you might have noticed) puts a lot of strain on scarce resources and at times a lot of money in consultancy fees, especially for our partners. The huge cost and effort it takes to appraise options can be a significant obstacle to achieving a good BCR in project evaluation. Lengthy appraisal processes can delay project implementation and increase costs, potentially affecting the overall BCR.
Important lesson in all our Appraisal Framework efforts has always been that we cannot do this all ourselves. We need to learn from others, their failed and successful attempts, share good practice. This is something we try to do by collaborating with other Strategic Transport Bodies via Common Analytical Framework (CAF).
Presentation and communication
With all those great tools and modelling we need ways to inform the Decision Makers of the different trade-offs.
Our biggest success to date is a Multi Criteria Analysis Framework called Network Appraisal Criteria (NAC) for Northern Powerhouse Rail – it’s had numerous rounds of improvements in the past and has brought a real value to our partners and DfT in presenting the most important appraisal metrics from across the Analytical Framework in one dashboard. Last year we have made a new step in adding an interactive mapping platform to present the results of the analysis from the Distributional Impact Appraisal, and hosting all our PowerBI dashboards from across the workstreams into Appraisal Visualisation Platform, making sure we present the results in an unbiased way, not just summarised as a score for the network but showing the spatial variation in impacts identified.
Looking ahead
The team has made huge strides in the industry but only through perseverance, overcoming countless setbacks and challenges, and building on the lessons learnt throughout, but as we continue to make progress in developing the tools and modelling that are needed for the Analytical Framework to be used on Northern transport business cases, the future is becoming increasingly tangible.
The TfN Offer and CAF have both shown us the growing numbers in requests made from our Northern partners seeking our data and Analytical Framework support with their business cases and with each successful milestone and breakthrough, the dream grows closer to reality.
There’s plenty more but by harnessing the power of innovation, determination and collaboration, we’re pushing the boundaries and challenging the current standards, and at times black box design of some transport models. But we cannot do it on our own, we need collaboration but collaboration in a true essence of the word – with effective communication between our teams, partners, our projects to keep generating ideas, and optimising the Analytical Framework to be representative of the Northern populations and their travel behaviours.
And as we’ve seen before, those also keep evolving and the transport interventions take a while to put in place. It’s going to be a long journey to a more resilient, equitable and sustainable transport in the North!