The latest Labour Market Overview, published by the ONS, provides us with a look at how the labour market has changed two years on from the start of the Coronavirus pandemic.
This Insight focuses largely on the headline indicators: economic activity, economic inactivity, the employment rate and the unemployment rate.
This indicator tells us the proportion of people either in work, or actively looking for employment within the past four weeks.
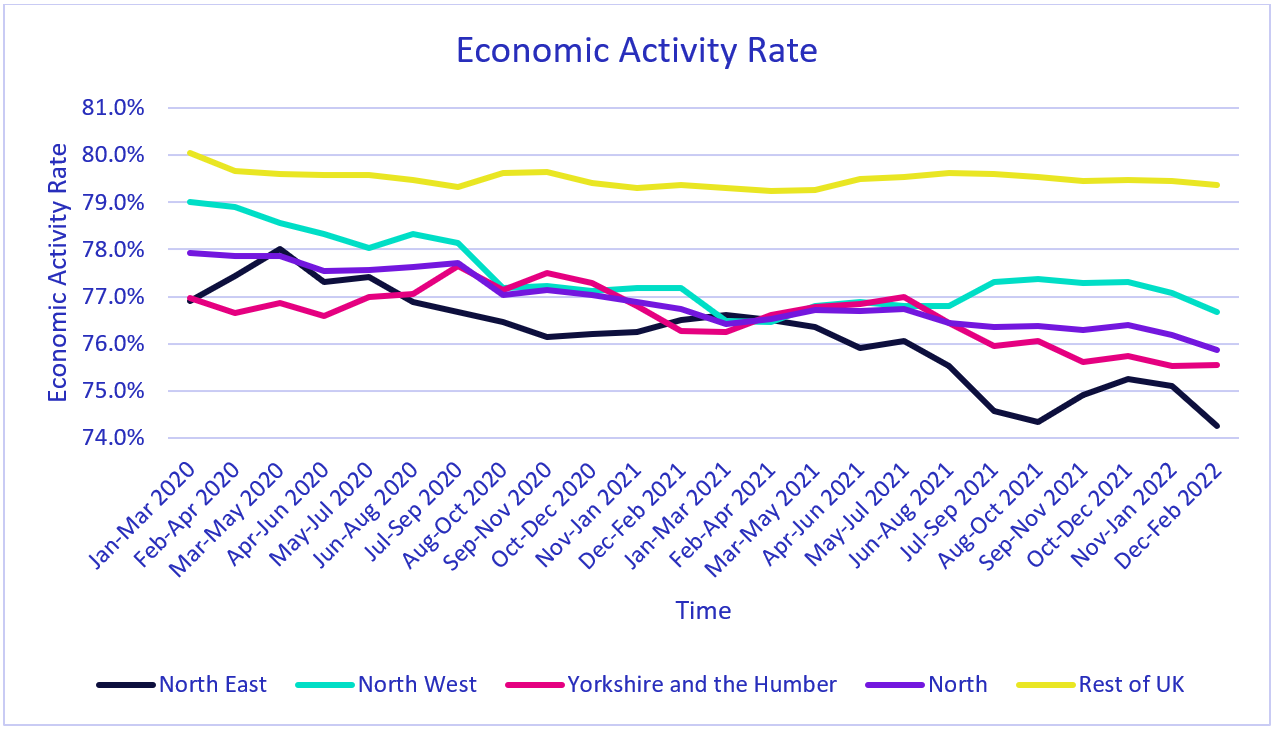
Across the North, you can see this proportion has dropped quite considerably, from around 78% pre-pandemic to around 76% last month, and this appears to have been a rather steady decline throughout the period.
This demonstrates a more pronounced impact to that experienced in the rest of the UK, where economic activity has only fallen by about half as much as in the North.
The key driver for this has been the North West, which, despite seeing an increase in economic activity at the beginning of the pandemic, has seen economic activity fall to its lowest rate since Summer 2018.
The inverse of the economic activity rate is the economic inactivity rate, which captures those not in employment who have not been seeking work within the past four weeks, and/or are unable to start work within the next two weeks.
One significant example of economically inactive people are students, who typically make up around 30% of a region’s economically inactive population.
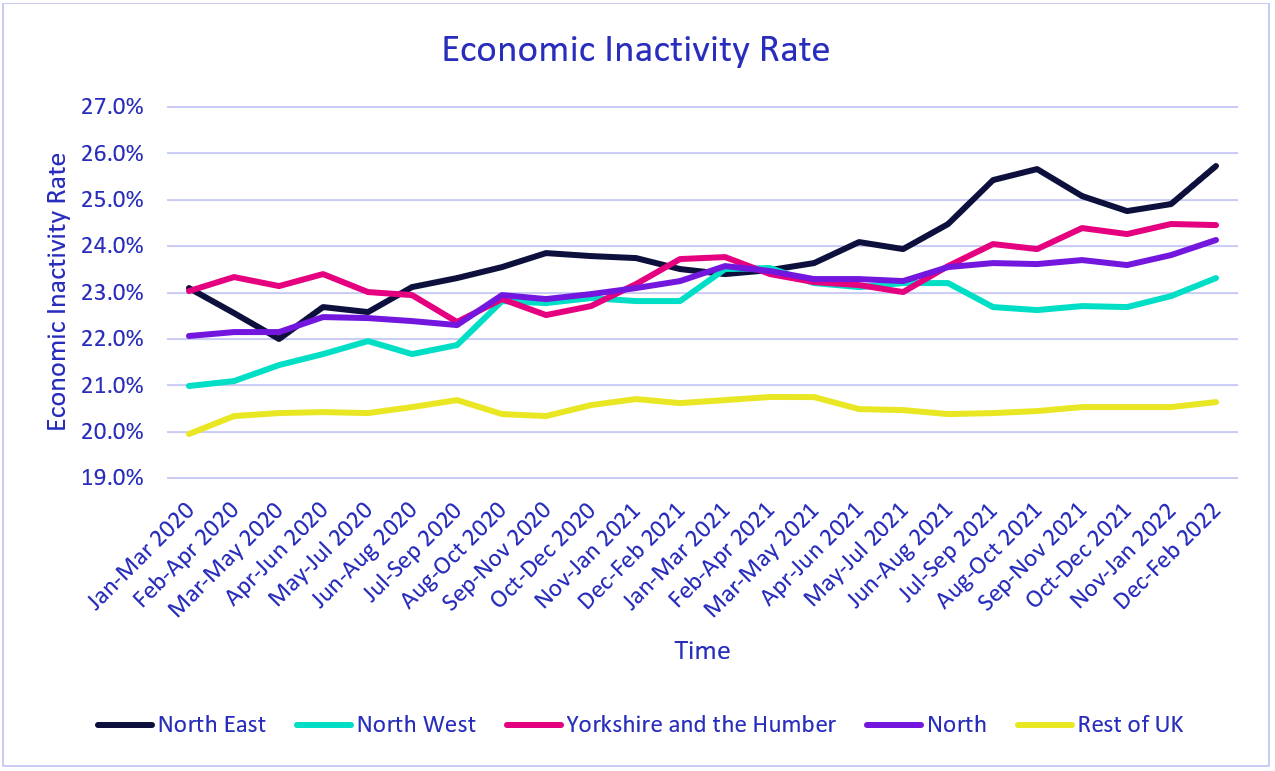
By definition, the economic inactivity rate is [100% minus the economic activity rate], so identical trends are observed.
The employment rate captures all individuals who are working as a proportion of the population.
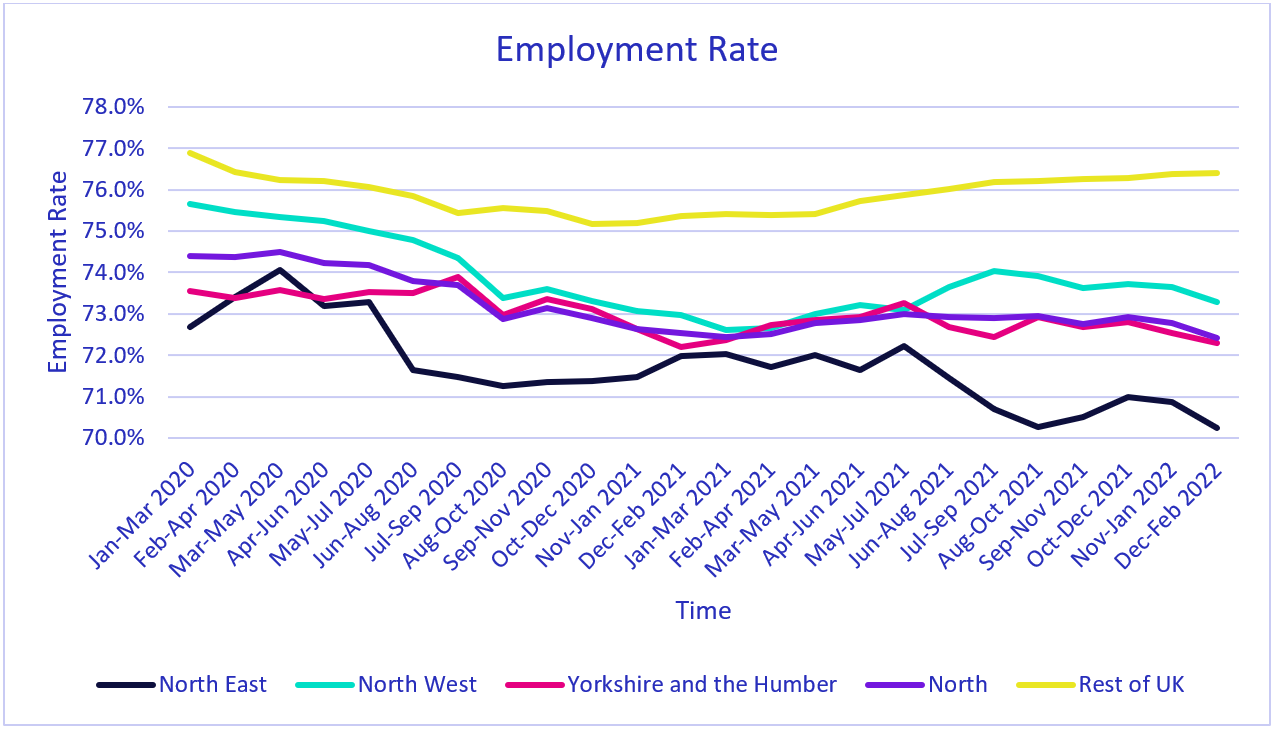
From the data, we can see the gap in the employment rates of the North and the rest of the UK has grown rather substantially throughout the pandemic, rising from 2.6% at the beginning of the pandemic to 4.0% today.
This growth in the difference between the North and the rest of the UK’s performance is due to both a relatively strong recovery in the rest of the UK, where employment is around 0.5 percentage points below pre-pandemic levels, and a lack of recovery in the North.
It is difficult to say why the North has performed so badly in the UK context during the pandemic, but nationally, we have seen a lot of people aged 55 and over leave employment and drop out of the labour market altogether – making themselves ‘economically inactive’.
The North’s significant rise in economic inactivity, along with its lack of employment recovery, means that it is likely that this phenomenon has been particularly present in the North.
The unemployment rate captures those who have been actively looking for employment within the past four weeks, as a proportion of all people who are economically active.
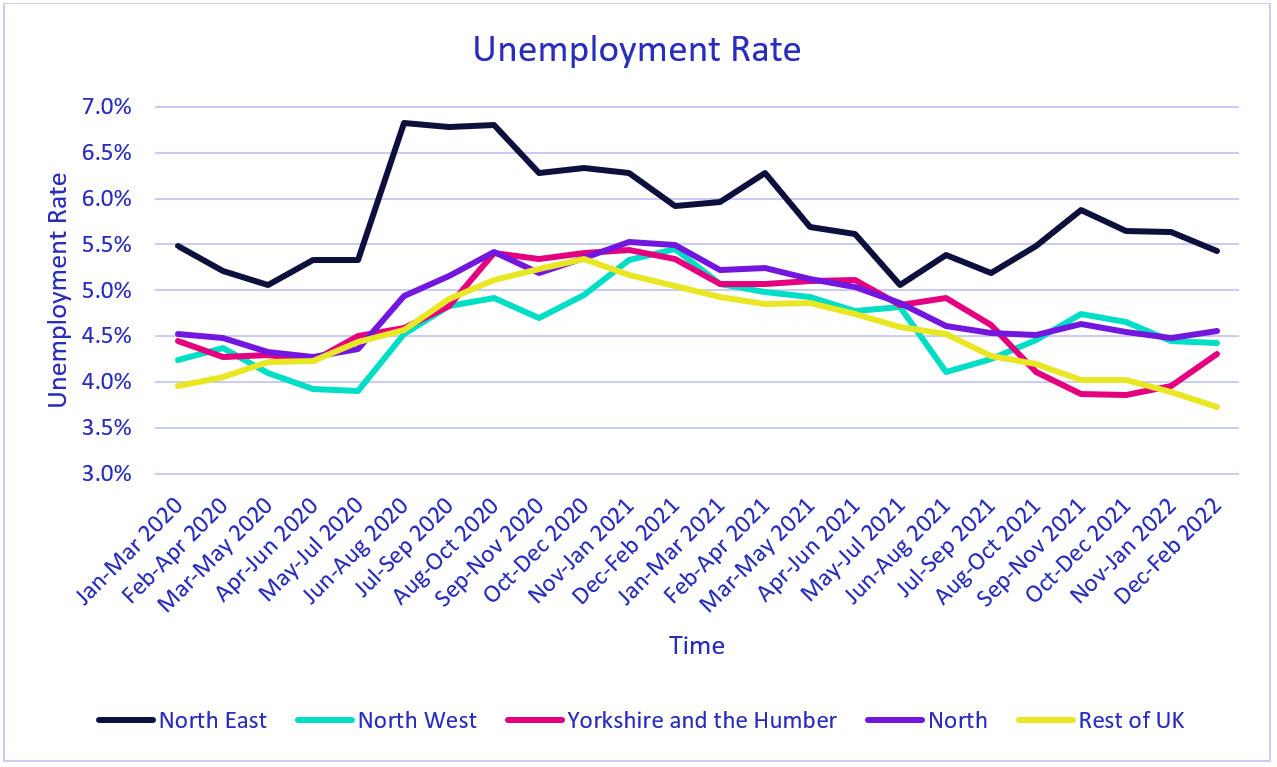
The above chart shows a clear outlier in the North East, whilst the other regions in the North, and indeed the North as a whole, have closely followed the patterns of the rest of the UK.
Indeed, from Autumn 2021 to Winter 2021, Yorkshire and the Humber saw a lower unemployment rate than the rest of the UK, highlighting a strong performance in the national context.
However, Summer 2020 saw unemployment rise from 5.3% to 6.8% in the North East – initially a cause for concern within the region.
Our chart above now shows the North East is back to pre-pandemic levels of unemployment, but that is still significantly higher than the levels of unemployment seen in the rest of the North.
Learn more about how Economics and Research plays a crucial role in building an evidence base to inform policy making and business case development.